Prelude <> Nov/Dec 2019 <> January 2020 <> February <> March <> April <> May <> June <>July <> August <> September <> Source Data
July 2020
By July, the Coronavirus pandemic has pretty much gone out of control across much of the United States. Daily new cases have exceeded 50,000 for the past several days and the rate of increase is on a logarithmic curve. At least thirty-one states are seeing daily increases in the number of new cases, and several states have either “paused” or “rolled back” their state’s re-opening due to new cases.
Effective July 1, The European Union has re-opened their borders for travel to most of the world, but excluded citizens of the United States, Russia, and Brazil, due to the uncontrolled rates of infections in these countries.
Of all the states, Arizona, Florida, and Texas appear to be the worse hit. Intensive care hospital beds in Houston, Texas, and Tuscon, Arizona are at capacity and Arizona has authorized what amounts to triage for doctors to decide who should receive intensive care treatment. There are continuing charges that the Florida department of Health is hiding data on rates of infections and COVD-19 deaths.
Meanwhile, the Trump administration appears to have given up on any efforts to combat and control the pandemic. Various statements from President Trump and his advisors range from complete denial (“we’ve done a great job”) to happy talk (“I think this will go away pretty soon. I hope”) to blaming anyone and everyone else for the debacle (“This was caused by China weaponizing the virus.”).
By all appearances, the United States is in very big trouble with no good answers for resolution.
Coronavirus Daily New Cases
Rolling Three-Day Averages
Data Source: Our World In Data
Coronavirus Daily New Deaths
Rolling Three-Day Averages
Data Source: Our World In Data
July 1
 Nationwide, federal and local officials are reporting alarming spikes in drug overdoses — a hidden epidemic within the coronavirus pandemic. Emerging evidence suggests that the continued isolation, economic devastation and disruptions to the drug trade in recent months are fueling the surge. Early data indicates Suspected overdoses nationally — not all of them fatal — jumped 18 percent in March compared with last year, 29 percent in April and 42 percent in May.The global tourism industry will lose at least $1.2 trillion this year amid crippling travel restrictions and consumer wariness during the coronavirus pandemic. The losses, equal to 1.5% of the world economy, could balloon to $3.3 trillion if the hit to international leisure travel persists until March 2021, with the harshest effects afflicting developing and island nations.The number of confirmed U.S. deaths due to the coronavirus is substantially lower than the true tally, according to a study published Wednesday in Internal Medicine. The study was supported by the NIH. The number of excess deaths from any causes were 28% higher than the official tally of U.S. Covid-19 deaths during those months.Nearly 350 public health organizations, advocacy groups and local health departments write a letter to urging him to play a more prominent role in shielding the from political interference. “ continues to be the world’s premiere public health institution and should be treated as such during this pandemic, “We must amplify the unfettered voice of , not stifle it.”A researcher at the California Institute for Rural Studies (CIRS), analyzed Monterey county’s daily COVID-19 cases against the industry in which each person was employed when they contracted the virus. He found that the prevalence of COVID-19 for agricultural workers was 1,410 positive cases out of 100,000, while the rate for workers in all other industries was 455 cases per 100,000 — a difference of almost 1,000 cases. Agriculture working and living conditions make it nearly impossible to maintain physical distance from others.President Trump Tweet: “I think we’re gonna be very good with the coronavirus. I think that at some point that’s going to sort of just disappear, I hope.” (with video clip.) Tweet: (About Trump’s planned July 3 celebration at Mt Rushmore) Masks will not be mandatory for the event, which will be attended by President Trump. PEOPLE ARE FED UP!
 Virginia pauses on entering phase III of re-opening. Gov. Ralph Northam announced that bars and restaurants are to continue operating under phase two restrictions. Michigan rolls back re-opening. Democratic Gov. Gretchen Whitmer signs an executive order closing indoor service at bars throughout most of lower Michigan. California Gov. Gavin Newsom orders tougher restrictions for much of the state, requiring 19 counties experiencing increased spread of coronavirus to halt visits to indoor restaurants, wineries and tasting rooms, entertainment centers, movie theaters, zoos, museums and card rooms. Newsom is also recommending the cancellation of all fireworks shows on the Fourth of July in the affected counties, and is urging all Californians to rethink having large get-togethers with friends and neighbors to celebrate the holiday.
Global Cases: 10,357,662 | Global Deaths: 508,055
July 2
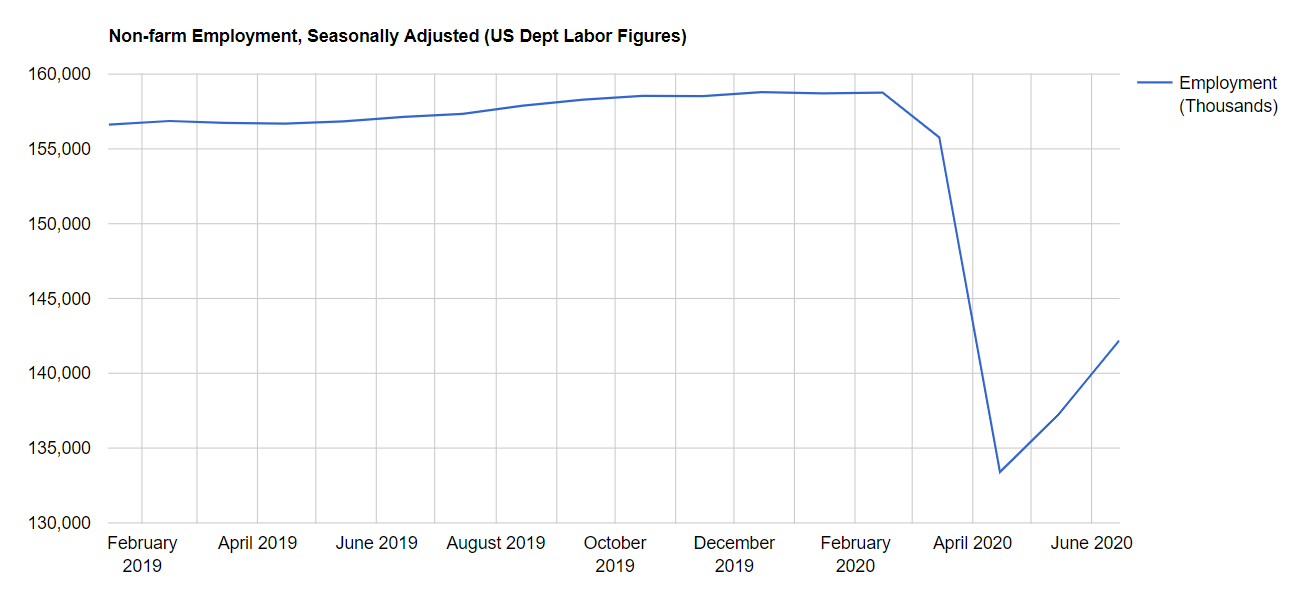
The Bureau of Labor Statistics announces U.S. economy added a record 4.8 million jobs in June, but a surge in new infections and a spate of new closings threatens the nascent recovery. A large number of Americans are finding their jobs are no longer available. The unemployment rate in June was 11.1 percent, down from a peak of 14.7 percent in April but still far above the 3.5 percent level notched in February. Bureau of Labor Data Source. The Congressional Budget Office announces the coronavirus pandemic gave such a shock to the labor market that it would not fully recover for more than 10 years.Texas Gov. Greg Abbott issues a nearly statewide mask mandate that requires Texans living in counties with 20 or more positive COVID-19 cases to wear a face covering over the nose and mouth while inside a business or other building open to the public, as well as outdoor public spaces, whenever social distancing is not possible. There are several categories of exemptions. Violations are punishable by a fine of up to $250. This is an about-face from his April 27 executive order prohibiting local governments mandating face masks. Tweet: We are sorry to announce that has tested positive for COVID-19, and is currently receiving treatment in an Atlanta-area hospital. Mr. Cain, 74, attended Mr. Trump’s indoor rally in Tulsa, Okla., on June 20. A few hours before the event, the Trump campaign disclosed that six staff members who had been working on the rally had tested positive for the virus during a routine screening. Two members of the Secret Service also tested positive there.During an interview, in a change of tone, President Trump states: “I’m all for masks.” When asked whether he would wear one, the president said: “If I were in a tight situation with people I would, absolutely.” He added that people have seen him wearing one before.Congressman accuses Fauci and Birx of “causing panic” by contradicting President Trump’s “goals and actions for returning to normalcy.“ and continue to contradict many of President Trump’s stated goals and actions for returning to normalcy as we know more about the COVID-19 outbreak. This is causing panic that compromises our economic recovery. We can protect our most vulnerable from the COVID-19 outbreak while still protecting lives and livelihoods of the rest of the population.” He called for the disbandment of the White House Coronavirus Task Force “so that President Trump’s message is not mitigated or distorted.”
Global Cases: 10,533,779 | Global Deaths: 512,842
July 3
 Video Clip: Interview with on the administration’s response to the pandemic. In a televised interview, suggests that China created the coronavirus as a weaponized virus, and deliberately sent infected Chinese citizens to the United States to spread this disease.After several months of mixed messages on the coronavirus pandemic, the White House is settling on a new one: Learn to live with it.Kimberly Guilfoyle, the girlfriend of President Trump’s eldest son and a top fund-raising official for the Trump re-election campaign, tested positive for the coronavirus on Friday before a Fourth of July event at Mount Rushmore, a person familiar with her condition said. Ms. Guilfoyle is the third person in possible proximity to Mr. Trump known to have contracted the virus. on President Trump’s Fourth of July celebration at Mount Rushmore: “I’m highly concerned. This is beyond irresponsible, This is the behavior of a cult leader who is jumping off the cliff, except he’s jumping off into a safety net where he has protections around him. People around him are being tested. He’s being tested on a regular basis. While he asks his followers to jump off a cliff into nothing. I mean, this is extremely dangerous behavior and unfortunately, this has become so politicized where you abide by public health and scientific recommendations on the basis of your political beliefs not based on the science. And people are really going to be harmed as a result of this.” writes to and demanding answers about the awarding of a non-competitive, multimillion dollar contract for a seemingly duplicative data collection system. The contract duplicates the work done by the ’s National Healthcare Safety Network (NHSN) by creating a second mechanism through which hospitals can report the same information already collected through NHSN. She also made clear that there are other pressing data needs that are still being unmet by the Trump Administration’s efforts including regrading health disparities.Tweet Thread: 1/10 – “Another week, more spread of #Covid19. Bottom line: it’s worse, will continue to get worse, and will take months to improve substantially.We are going in the wrong direction, fast.”Florida set another daily record for new infections, reporting 11,458 confirmed cases. The state has reported multiple daily records since late June, and the rate of positive test results has climbed into the double digits. Only New York has tallied more cases in a single day, with 11,571 on April 15.
Global Cases: 10,710,005 | Global Deaths: 517,877
July 4
US Dept of Labor Report: The total number of people claiming initial jobless benefits for the week ending July 4 was 1.31 million, a decrease of 1,435 thousand from the previous week.Florida and Texas hit a record number of daily coronavirus cases, Florida reporting 11,445 and Texas 8,258 new cases. Florida reports 14.1% of those tested for the virus were positive while Texas reported a positive rate of 13.1%, both well above the 5% threshold that the advises as a safe level for governments to reopen business.Global Cases: 10,922,324 | Global Deaths: 523,011

July 5
New federal data reveals Black and Latino people have been disproportionately affected by the coronavirus in a widespread manner that spans the country in urban, suburban and rural areas, and across all age groups. Latino and African-American residents have been three times as likely to become infected as their white neighbors, And Black and Latino people have been nearly twice as likely to die from the virus as white people.President Trump Press Brief: “Likewise, testing — there were no tests for a new virus, but now we have tested over 40 million people. But by so doing, we show cases, 99 percent of which are totally harmless. Results that no other country will show, because no other country has testing that we have — not in terms of the numbers or in terms of the quality.”Tweet: TV News “Face the Nation”: @margbrennan : “We think it’s important for our viewers to hear from and the @CDCgov But we have not been able to get our requests for Dr. Fauci approved by the Trump administration in the last three months. And the not at all. We will continue our efforts” (with video clip)Global Cases: 11,125,245 | Global Deaths: 528,204
July 6
The Trump administration is “crafting messages” meant to “convince Americans that they can live with the virus. White House officials also hope Americans will grow numb to the escalating death toll and learn to accept tens of thousands of new cases a day. A senior official states Americans will “live with the virus being a threat.”Trump Tweet: BREAKING NEWS: The Mortality Rate for the China Virus in the U.S. is just about the LOWEST IN THE WORLD! Also, Deaths in the U.S. are way down, a tenfold decrease since the Pandemic height (and, our Economy is coming back strong!). John Hopkins University of Medicine ranks the COVID-19 mortality rate of the United States as seventh highest in the world, just under Egypt.Florida will require schools to reopen in August despite a surge in coronavirus cases. The order appears to follow President Donald Trump’s wishes. He tweeted, “SCHOOLS MUST OPEN IN THE FALL!!!” which state Commissioner Department of Education, Richard Corcoran, retweeted after announcing the emergency order. Florida has the third-highest number of coronavirus cases in the US at 206,000 and counting.In its announcement of an outdoor rally scheduled for Saturday at Portsmouth International Airport in Portsmouth, New Hampshire, the Trump campaign urged supporters to wear masks at the event. “There will be ample access to hand sanitizer and all attendees will be provided a face mask that they are strongly encouraged to wear.” on Monday said that he has decided against attending this year’s Republican National Convention for the first time in 40 years because of “the virus situation.” This year’s RNC is set to be held in Jacksonville, Florida in late August after being moved from Charlotte, North Carolina. announces that International students who are pursuing degrees in the United States will have to leave the country or risk deportation if their universities switch to online-only courses, The move may affect thousands of foreign students who come to the United States to attend universities or participate in training programs, as well as non-academic or vocational studies.Data released by the shows that Transportation Secretary Elaine Chao’s family’s shipping business, firms owned by foreign companies, and at least seven members of Congress or spouses received loans, including lawmakers who were directly involved in shaping regulations, as part of its $660 billion small-business relief program. The also handed out loans to nearly 90,000 companies without promising on their applications they would rehire workers or create jobs.A letter signed by 239 scientists appeals to the medical community and to the relevant national and international bodies via a signed letter to recognize the potential for airborne spread of coronavirus disease 2019 (COVID-19). There is significant potential for inhalation exposure to viruses in microscopic respiratory droplets (microdroplets) at short to medium distances (up to several meters, or room scale), and these scientists are advocating for the use of preventive measures to mitigate this route of airborne transmission.Global Cases: 11,327,790 | Global Deaths: 532,340
July 7
The watchdog group Public Citizen reports Forty lobbyists with ties to President Donald Trump helped clients secure more than $10 billion in federal coronavirus aid, among them five former administration officials whose work potentially violates Trump’s own ethics policy. Many are donors to Trump’s campaigns, and some are prolific fundraisers for his reelection. Religious organizations across the U.S. have received at least $7.3 billion in federal rescue package loans, with evangelical leaders tied to President Trump and megachurches tied to scandals pulling in some of the largest payouts. Businesses tied to President Donald Trump’s family and associates stand to receive as much as $21 million in government loans designed to shore up payroll expenses for companies struggling amid the coronavirus pandemic.Coronavirus cases across the across the South and Southwest are rising so rapidly contact tracing is no longer possible. states “The rapid rise in cases is considered a surge, not a second wave, because the infection numbers never lowered to where officials hoped they would.” In Florida, 43 hospitals across 21 counties — including Miami-Dade, Broward, Hillsborough and Orange Counties — have hit capacity and show zero ICU beds available.President Trump vows to exert pressure on states to reopen their school districts this fall even as large parts of the country are experiencing a spike in COVID-19 cases. “We’re very much going to put pressure on governors and everybody else to open the schools, Get open in the fall. We want your schools open.” Education groups have asked for at least $200 billion in federal funding to reopen safely and plug holes in state budgets due to the recession. So far, $13.5 billion has been appropriated to K-12 education. The Republican-controlled Senate has not taken up a bill passed by House Democrats that would allocate hundreds of billions more. Tweet: AZAR () says schools can safely reopen. “Health care workers don’t get infected because they take appropriate precautions. They engage in social distancing, wear facial covering….This can work. You can do all of this, there’s no reason schools have to be in any way any different.” In some states, medical personnel account for as many as 20% of known coronavirus cases. Investigative reporting has identified identified 765 such workers who likely died of COVID-19 after helping patients during this pandemic. Video clip: echoes President Trump’s statement that there’s no excuse for schools not to reopenThe White House has officially moved to withdraw the United States from the WHO by submitting its withdrawal notification to the United Nations secretary-general. Withdrawal requires a year’s notice, so it will not go into effect until July 6, 2021.The personal protective gear that was in dangerously short supply during the early weeks of the coronavirus crisis in the U.S. is running low again as the virus resumes its rapid spread and the number of hospitalized patients climbs. Rear Adm. John Polowczyk, who is in charge of coronavirus-related supplies for the White House, told Congress last week that more than than one-fourth of the states have less than a 30-day supply. “It would seem like in less than 30 days, we’re going to have a real crisis,” says Rep. Bill Foster (D-IL).New York City will vote on on allowing 3,000 childcare centers to reopen on July 13. Reopenings will be subject to strict state requirements, with no more than 15 children per room, social distancing, face coverings for staff and children, daily health screenings, frequent cleanings and disinfections, limited sharing of items. Only 125 childcare programs have been open since April, for the children of essential workers.Sens. Susan Collins (R-ME), Lisa Murkowski (R-AK) and Mitt Romney (R-UT) have now joined and in opting out of the Republican National Convention as coronavirus cases continue surging across the country.Global Cases: 11,500,302 | Global Deaths: 535,759
July 8
White House Coronavirus Task Force Briefing. Vice President Pence couched guidance from the Centers for Disease Control and Prevention on how to safely reopen schools, saying it shouldn’t be used as a “barrier” to students returning to classrooms. Pence stressed that states and local governments should “tailor their plans” to enable to students to return to in-person instruction. “None of the CDC’s recommendations are intended to replace state and local rules and guidance.” Pence also stated that his expert on school re-openings was his wife, Karen.President Trump Tweet: “In Germany, Denmark, Norway, Sweden and many other countries, SCHOOLS ARE OPEN WITH NO PROBLEMS. The Dems think it would be bad for them politically if U.S. schools open before the November Election, but is important for the children & families. May cut off funding if not open!” President Trump Tweet: “I disagree with @CDCgov on their very tough & expensive guidelines for opening schools. While they want them open, they are asking schools to do very impractical things. I will be meeting with them!!!” interview: Schools Must ‘Fully Open’ by Fall, Distance Learning Is a ‘Disaster’ told the Wall Street Journal that a second shutdown might be the best move for states struggling with burgeoning coronavirus cases and hospitalizations. “I think any state that is having a serious problem, that state should seriously look at shutting down.”The is requiring the small nonprofit research organization to take unusual—and perhaps impossible—steps to end a controversial suspension of a grant related to bat coronavirus research in China. On April 24, after President Trump complained about ’s grant to the because it involved researchers at China’s , abruptly canceled the grant, stating that its goal of studying bat coronavirus spillovers into humans did not “align with … agency priorities.” Now, the has told the nonprofit that it may have its funding back—if it collects and hands over materials and information about the Institute.British researchers release a study indicating COVID-19 infections could lead to brain damage in infected patients. Experts at the University College London (UCL) were the latest to describe that Covid-19 could cause neurological complications including stroke, nerve damage, and potentially fatal brain inflammation — even if the patients didn’t show severe respiratory symptoms associated with the disease.Harvard and M.I.T. are the first universities to file a lawsuit against the Trump administration over a directive that would strip foreign students of their visas if their coursework was entirely online.Tulsa County, Oklahoma, reported 206 new confirmed cases on July 7 and a record high 261 July 6. Dr. Bruce Dart, the director of the Tulsa Health Department, said it was reasonable to link the spike to President Trump’s recent rally which drew 6,200 people. “The past two days we’ve had almost 500 cases, and we know we had several large events a little over two weeks ago, which is about right,” Dr. Dart said. “So I guess we just connect the dots.”Thirty-two percent of Americans did not make a full on-time housing payment in July. This marks the fourth month in a row with a ‘historically high’ number of households that were unable to make the payments on time and in full – up from 30 percent in June and 24 percent in April. At the start of the pandemic short term displacement bans were put in place to keep people in their homes,But many of those protections are nearing their expiration dates. The federal government’s $600 weekly unemployment checks are set to expire by the end of July.An Ohio Republican lawmaker is using conspiracy theories to justify giving potentially dangerous advice to his constituents. “Are you tired of living in a dictatorship yet,” GOP Rep. Nino Vitale asked Tuesday in a Facebook post. “This is what happens when people go crazy and get tested. STOP GETTING TESTED!”Global Cases: 11,669,259 | Global Deaths: 539,906
July 9
Interview: Alabama state Sen. Del Marsh ( R ) is not concerned about reaching more than 2,000 cases in one day. Marsh says he wants to see more people with COVID-19 because “we start reaching an immunity as more people have it and get through it.” Florida Gov. Ron DeSantis (R) says “if we can shop at Home Depot and Walmart, we can open schools.”Officials in Florida’s Miami-Dade County report a staggering 33.5% Covid-19 positivity rate , according to data released by Mayor Carlos Gimenez’s office. The goal is to not exceed a positivity rate of 10%. The county has exceeded the 18% mark for the past 14 days. The current 14-day average is 24%.In a case filed by Kentucky Agriculture Commissioner Ryan Quarles (R), and joined by Kentucky Attorney General Daniel Cameron (R), A circuit judge orders Kentucky Gov. Andy Beshear (D) to cease issuing or enforcing executive orders related to Covid-19. The governor had just signed executive order mandating that Kentuckians must wear a facial covering or mask in public in certain situations.Mississippi state health officer Dr. Thomas Dobbs confirmed that a recent COVID-19 outbreak at the state’s Capitol building in Jackson led to 36 people catching the virus, 26 of whom are Mississippi lawmakers. They include Lt. Gov. Delbert Hosemann (R) and State House Speaker Philip Gunn (R). Few legislators and public officials have been wearing masks at the Capitol. states the will not revise its guidelines for reopening schools despite calls from the White House to do so. “Our guidelines are our guidelines, but we are going to provide additional reference documents to aid basically communities in trying to open K-through-12s,” Redfield said. “It’s not a revision of the guidelines; it’s just to provide additional information to help schools be able to use the guidance we put forward.” As the country enters a frightening phase of the pandemic with new daily cases surpassing 57,000, the is coming under intense pressure from President Trump and his allies, who are downplaying the dangers in a bid to revive the economy ahead of the Nov. 3 presidential election. In a White House guided by the president’s instincts, rather than by evidence-based policy, the finds itself forced constantly to backtrack or be sidelined from pivotal decisions. pleads for international unity to fight the pandemic devastating the world in the wake of President Trump’s announced intention to quit the organization. With tears in his eyes, Tedros asks; “How difficult is it for humans to unite to fight a common enemy that’s killing people indiscriminately? Can’t we understand that the divisions or the cracks between us actually are to the advantage of the virus? In most of the world, the virus is not under control; it’s getting worse.” Video of opening remarks at the conference.The releases a new scientific report detailing how the coronavirus can pass from one person to the next — including through the air during certain medical procedures, and possibly through the air in crowded indoor spaces. The report says that “to the best of our understanding,” the virus is primarily spread through contact and respiratory droplets, but there are still many unanswered questions around airborne transmission and “more studies are urgently needed.” The report comes after the July 6 publication of a letter signed by 239 scientists, that urged the agency to be more forthcoming about the likelihood that people can catch the virus from droplets floating in the air.As the coronavirus spreads around the world, the Trump administration has steadily choked off most avenues for legal immigration to the United States — effectively shutting down the system that brings in hundreds of thousands of immigrants annually. (Reference includes charts.)Across the globe, violence has emerged a major and persistent side effect of the pandemic that has stricken 12 million people and killed more than 550,000. Even as it overwhelms hospitals, COVID-19 is also straining security forces in scores of countries, exacerbating long-standing conflicts while fueling grievances and spurring the growth of extremist groups.Global Cases: 11,874,226 | Global Deaths: 545,481
July 10
The U.S. Roman Catholic Church used a special and unprecedented exemption from federal rules to amass at least $1.4 billion in taxpayer-backed coronavirus aid, with many millions going to dioceses that have paid huge settlements or sought bankruptcy protection because of clergy sexual abuse cover-ups. The church’s haul may have reached — or even exceeded — $3.5 billion, making a global religious institution with more than a billion followers among the biggest winners in the U.S. government’s pandemic relief efforts.Disney World re-opens its Magic Kingdom and Animal Kingdom Park near Orlando, Florida, with several restrictions and entrance health checks. Florida reports 11,433 new Covid-19 cases — its second-highest count for one day. With Florida adding coronavirus infections at the rate of about 10,000 per day, Miami has emerged as one of the most significant coronavirus hot spots in the United States.The American Academy of Pediatrics (AAP), American Federation of Teachers (AFT), National Education Association (NEA) and AASA, The School Superintendents Association, issue a joint statement recommending children return to in-person classes in the fall. Citing “science-driven decision making, they place responsibility on local school leaders, public health experts, educators and parents to make the decisions about how and when to reopen schools.More than 4,100 service members have tested positive for coronavirus since the July 1, according to the Defense Department’s latest statistics, a rise of about 33 percent in the last 10 days. That is more than twice the rate of growth nationwide during the same period, 16 percent, as the U.S. more than once broke its daily records for new cases.Dr. Emily Benfer, chair of the American Bar Association’s Task Force Committee on Eviction and co-creator of the COVID-19 Housing Policy Scorecard, with the Eviction Lab at Princeton University: We have never seen this extent of eviction in such a truncated amount of time in our history. “We can expect this to increase dramatically in the coming weeks and months, especially as the limited support and intervention measures that are in place start to expire. About 10 million people, over a period of years, were displaced from their homes following the foreclosure crisis in 2008. We’re looking at 20 million to 28 million people in this moment, between now and September, facing eviction.”An investigation by The New York Times in collaboration with The Marshall Project reveals how unsafe conditions and scattershot testing helped turn ICE into a domestic and global spreader of the virus — and how pressure from the Trump administration led countries to take in sick deportees. Over 750 domestic ICE flights were tracked since March, carrying thousands of detainees to different centers, including some who said they were sick. So far, governments of 11 countries have confirmed deportees returned home with Covid-19. Atlanta, Georgia, Mayor Keisha Lance Bottoms (D) announces the city’s reopening roll back to Phase 1, citing an alarming increase in coronavirus cases. Georgia governor Brian Kemp ( R ) states the mayor’s plan is not “legally enforceable” because he signed an executive order that prohibits local action from being more prohibitive than the state’s requirements. Georgia sets a record 4,484 new daily coronavirus case reports.Global Cases: 12,102,328 | Global Deaths: 551,046
July 11
US Dept of Labor Report: The total number of people claiming initial jobless benefits for the week ending July 11 was 1.3 million, a decrease of 1,375 thousand from the previous week.As President Donald Trump and his administration push for students and teachers to return in-person to classrooms, investigative reporting uncovers internal documents from the warn that fully reopening K-12 schools and universities would be the “highest risk” for the spread of coronavirus.President Donald Trump pays a visit to wounded service members at Walter Reed National Military Medical Center and wore a mask after months of refusing to be seen doing so in public. The President’s decision to wear a mask during his Saturday trip to the medical center comes after months of declining to publicly wear one — against the recommendations of his own administration’s public health experts.As the Trump administration has strayed from the advice of many of its scientists and public health experts, the White House has moved to sideline , scuttled some of his planned TV appearances and largely kept him out of the Oval Office for more than a month. Fauci last spoke to the president during the first week of June, and is “never in the Oval [Office] anymore.”Global Cases: 12,322,395 | Global Deaths: 556,335
July 12
During a “State of the Union” televised interview, refuses to say whether schools should follow guidelines from the on reopening “The guidelines are just that, meant to be flexible and meant to be applied as appropriate for the situation. “There is nothing in the data that would suggest that kids being back in school is dangerous to them.” health guidance says children are at highest risk when meeting in full-sized, in-person classes. Video Clip of “State of the Union” interview. Test results for Covid-19 are taking so long to come back that experts say the results across the United States are often proving useless in the campaign to control the deadly disease. Some testing sites are struggling to provide results in five to seven days. Others are taking even longer. The long testing turnaround times are making it impossible for the United States to replicate the central strategy used by other countries to effectively contain the virus — test, trace and isolate. Like catching any killer, speed is of the essence when it comes to the coronavirus.Utility shutoffs threaten a fresh crisis for low-income and Black families as Covid-19 surges again.Tweet: “You wanna sell a lie? Get the press to sell it for you.” (Image lists the number of attacks against to the press by members of the White House Administration). The Florida Department of Health reported 15,299 new Covid-19 cases Sunday, the highest number of new cases reported in a single day by any state since the coronavirus pandemic began.Global Cases: 12,552,765 | Global Deaths: 561,617
July 13
Video clip interview of Acting Deputy Secretary of Homeland Security Ken Cuccinelli on the Trump administration’s latest push for international students to leave the US if their colleges or universities institute online-only learning measures.Louisiana Republican Senator John Kennedy interview: “There are some people who want to keep our schools closed because they think it gives them a political advantage. They are using our kids as political pawns. To them I say, unashamedly, that they can kiss my a**.”Attorneys general in 17 states and the District of Columbia file a lawsuit against the Trump administration over its guidance to not allow foreign students to take online-only courses this fall semester. Massachusetts Attorney General Maura Healey, heading up the effort, said “The Trump Administration didn’t even attempt to explain the basis for this senseless rule, which forces schools to choose between keeping their international students enrolled and protecting the health and safety of their campuses.Opinion Column: the Trump White House is treating the nation’s leading infectious-disease expert like some kind of political opponent. Now White House aides have begun circulating talking points to undermine Fauci, documenting how many times he has said things that have turned out to be wrong. Many of the Fauci statements being circulated by the White House are incomplete and taken out of context.When Michigan’s eviction moratorium lifts on July 16 the state estimates a backlog of 75,000 eviction filings. Although Michigan created a $50 million fund to assist renters, Jim Schaafsma, an attorney with the Michigan Poverty Law Program, estimates it would take more than $56 million dollars to assist just 20% of renter households who are extremely low-income for one month.The U.S. budget deficit widened to a record-high $864 billion last month because of the federal government’s extraordinary response to the coronavirus pandemic. In June 2019, the budget deficit was just $8 billion. In prior years, the federal deficit was considered large when it approached or eclipsed $1 trillion for an entire year. This year the U.S. spent about $2 trillion more than it took in via tax revenue from April to June alone.The Trump administration is poised to ask governors to consider sending in the National Guard to hospitals to help improve data collection about novel coronavirus patients, supplies and capacity, according to draft letters, internal emails and officials familiar with the plans. officials on Monday finalized a new data reporting protocol for hospitals, which will eliminate the as a data recipient, leaving health-care institutions to report information about Covid-19 to a federal contractor or to their state, which will coordinate the federal reporting.Global Cases: 12,768,307 | Global Deaths: 566,654
July 14
Video clip: In a press briefing, Trump claims Biden and Obama stopped their testing, and the high numbers of Covid-19 cases result from excessive testing.The Coronavirus task Force compiles documents showing 19 states are in the “red zone,” and pleads with state officials to increase testing. President Trump continues to insist the country is testing too much and that the virus will soon “disappear.”The US unemployment rate, currently at 11.1 percent, is higher than at any point during the Great Recession. The $600 federal unemployment insurance weekly subsidy is set to expire at the end of the month, even as experts credit the benefit as a crucial lifeline preventing countless families from descending into poverty. In response, the Trump administration launches a “Find Something New” ad campaign, encouraging people to seek retraining and new careers. The campaign is a product of the American Workforce Policy Advisory Board, co-chaired by Ivanka Trump and Commerce Secretary Wilbur Ross.Data provided by YELP shows nearly 66,000 businesses have permanently closed since March 1. From June 15 to June 29, the most recent period for which data is available, businesses were closing permanently at a higher rate than in the previous three months, Researchers at Harvard believe the rates of business closures are likely to be even higher. They estimated that nearly 110,000 small businesses across the country had decided to shut down permanently between early March and early May. publishes a oped titled “Anthony Fauci has been wrong about everything I have interacted with him on.” His closing statement is “So when you ask me whether I listen to ’s advice, my answer is: only with skepticism and caution.”The Trump administration orders hospitals to bypass the and, send all coronavirus patient information to a new central database — a move that has alarmed public health experts who fear the data will be distorted for political gain. The new instructions are contained in a little-noticed document posted this week on the ’ website. From now on, , and not the , will collect information vital to tracking the pandemic.President Trump Retweet from : “The most outrageous lies are the ones about Covid 19. Everyone is lying. The , Media, Democrats, our Doctors, not all but most ,that we are told to trust. I think it’s all about the election and keeping the economy from coming back, which is about the election. I’m sick of it.”The Trump administration has rescinded its policy that would bar international students who only take online courses from staying in the US, a federal judge announced Tuesday in Boston. the White House is now focused on having the rule apply only to new students, rather than students already in the US.Miami, Florida, has become the world’s epicenter of COVID-19 infections. Dr. Lilian Abbo, chief for infection prevention at Jackson Health System, says “Miami is now the epicenter of the pandemic. What we were seeing in Wuhan six months ago, now we are there.” Nearly one-in-three children tested for the new coronavirus in Florida has been positive, and a South Florida health official is concerned the disease could cause lifelong damage even for children with mild illness. Dr. Alina Alonso, Palm Beach County’s health department director, warned county commissioners Tuesday that much is unknown about the long-term health consequences for children who catch COVID-19.An unpublished report by the White House Coronavirus Task Force suggests that at least 18 hard-hit states — including Georgia — enact stricter measures such as mask requirements and increased testing. The document, obtained by the Center for Public Integrity, says 18 states are in the “red zone” for COVID-19 cases, meaning they had more than 100 new cases per 100,000 population last week. Eleven states are in the “red zone” for test positivity, meaning more than 10 percent of diagnostic test results came back positive. Conservative radio commentator Rush Limbaugh Show: Americans should “adapt” to coronavirus, like pioneers who “had to turn to cannibalism.”
 Global Cases: 12,964,809 | Global Deaths: 570,288

July 15
President Trump posted a pic on Instagram that showed him at his desk with a variety of Goya products, including cookies, coconut milk and adobo. This photo was in response to recent statements by the CEO of Goya praising Trump, triggering a backlash and threatened boycott by Hispanics. The White House distanced itself from an extraordinary op-ed in which , President Trump’s trade adviser, heavily criticized , the nation’s top infectious-disease official. White House spokeswoman Alyssa Farah said in a tweet: “The Peter Navarro op-ed didn’t go through normal White House clearance processes and is the opinion of Peter alone. White House aides previously circulated talking points questioning statements Fauci has made about the novel coronavirus, which Navarro repeated in the article.Starting today, the way the government collects and reports Covid-19 data moves from an established 15 year-old system to a new contractor-managed system under. “HHS Protect” is developed by Palantir Technologies, a data-mining firm that works with a number of federal agencies and co-founded by Peter Thiel, a billionaire Trump supporter. The data system was created through a $10 million no-bid contract awarded by to create the data system that duplicates one the already had. The company last week confidentially filed paperwork with the US Securities and Exchange Commission to go public, and a contract to collect Covid-19 data could sweeten the IPO deal. As part of the new data collection policy, the Trump administration includes a peculiarly nasty stick. Underlined on the first page of the instructions is that “We will no longer be sending out one-time requests for data to aid in the distribution of Remdesivir or any other treatments or supplies. This daily reporting is the only mechanism used for the distribution calculations, and the daily [sic] is needed daily to ensure accurate calculations.” Two weeks ago, the Trump administration bought up almost all of the world’s supply of the drug for the next three months.Georgia reports 3,871 new cases of the disease, the second-highest daily count to date, and 37 deaths. So far, 127,834 people have tested positive for COVID-19, more than double the number reported in mid-June, and 3,091 have died from it. The rate of new tests that are positive for the disease is soaring.Georgia Republican Governor Brian Kemp issues an executive order explicitly banning cities and counties from requiring the use of masks or other face coverings. The governor’s previous coronavirus orders have for months banned local governments from taking more restrictive or lenient steps than the state, but this is the first order expressly prohibiting cities and counties from requiring the use of face masks.Gov. Andrew Cuomo (D) announced on Twitter that New York will send 7,500 COVID-19 test kits, 30,000 pieces of personal protective equipment and 1,250 gallons of hand sanitizer to Atlanta, Georgia, by Friday. Atlanta Mayor Keisha Lance Bottoms (D), who earlier this week sought the state’s help amid a mounting feud with Georgia governor Brian Kemp (R), said she was grateful.Global Cases: 13,150,645 | Global Deaths: 574,464
July 16
US, UK and Canadian security officials announce activity by a Russian hacking group called APT29, which also goes by the name “the Dukes” or “Cozy Bear” is targeting organizations involved in coronavirus vaccine development.An advisory published by the UK National Cyber Security Centre (NCSC) states “APT29’s campaign of malicious activity is ongoing, predominantly against government, diplomatic, think tank, healthcare and energy targets to steal valuable intellectual property.”Tweet of White House Press Secretary Kayleigh McEnany: “The President has said unmistakably he wants schools to open up… When he says open, he means open in full… the science should not stand in the way of this..”Georgia Gov. Brian Kemp (R) on Thursday sued to stop Atlanta from enforcing some of its coronavirus-related rules, including its recent mandate to wear a face covering in public. The lawsuit alleges that Mayor Keisha Lance Bottoms (D) lacked the authority to implement a mask requirement and that she must obey Kemp’s executive orders, including one signed Wednesday night that explicitly bans municipalities from enacting their own mask ordinances.Coronavirus cases shut down Florida’s emergency operations center. The emergency center in question is located in Tallahassee. And while Florida officials have predictably not given any numbers in their statements about this closure, media sources report at least 13 people at the center tested positive for the virus. The Republican National Committee is planning to sharply limit attendance for its convention in Jacksonville, Fla. next month, shrinking the event celebrating President Donald Trump’s renomination amid concerns about coronavirus.Previously public data has already disappeared from the ’s website after the Trump administration quietly shifted control of the information to the Department of Health and Human Services.Josh Marshall Tweet: “Not too much to say that the entire weight of the federal government is now harnessed to hiding information about the pandemic and force-marching the economy and schools into a dead cat bounce to salvage President Trump’s reelection prospects. That’s really it.”The announces the extension of a No Sail Order for cruise ships through September 30, 2020. This order continues to suspend passenger operations on cruise ships with the capacity to carry at least 250 passengers in waters subject to U.S. jurisdiction.Global Cases: 13,378,853 | Global Deaths: 580,045
July 17
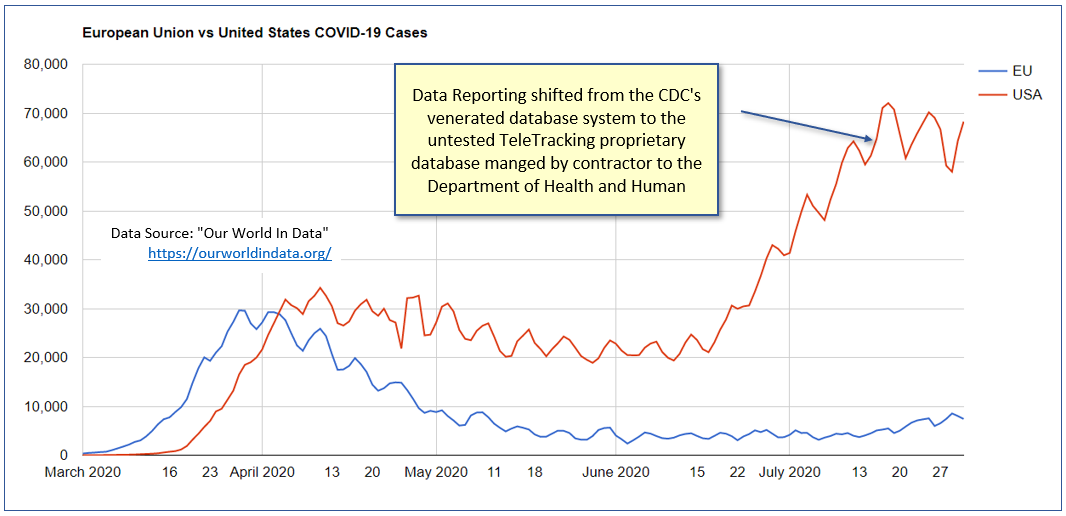
Two days after the White House instructed hospitals to report data to the through a new system created by a Pennsylvania-based company, TeleTracking, instead of sending the information to the as they had been doing, Hospital data in Kansas and Missouri is suddenly incomplete or missing.Global Cases: 13,616,593 | Global Deaths: 585,727
July 18
US Dept of Labor Report: The total number of people claiming initial jobless benefits for the week ending July 11 was 1.416 million, an increase of 109 thousand from the previous week. This is the first week since March 2020 first time claims have increased.The Trump administration is trying to block billions of dollars for states to conduct testing and contact tracing in the upcoming coronavirus relief bill, people involved in the talks said Saturday. The administration is also trying to block billions of dollars that GOP senators want to allocate for the Centers for Disease Control and Prevention, and billions more for the Pentagon and State Department to address the pandemic at home and abroad, the people said.Despite mounting pressure from President Trump to reopen full time, in the span of two weeks at least half a dozen school systems in D.C., Maryland and Virginia declared they will start the fall fully virtual. Some that had previously chosen a hybrid model made a last-minute switch. Most dramatically, District officials changed their minds an hour before they were scheduled to debut a plan for in-person instruction, instead announcing they would wait until July 31 to make a final decision.Tweet: In a televised interview, President Trump Trump claims that he’ll be “right eventually” about the coronavirus “disappearing.”‘’ events, triggered by people who may not even know they are infected, propel the coronavirus pandemic. Jose-Luis Jimenez, a researcher at the University of Colorado Boulder, is one of 239 scientists who penned an open letter to the WHO, calling for greater recognition of the role that clouds of fine aerosols containing the virus may play in its spread. “It is becoming clear that the pandemic is driven by events, and that the best explanation for many of those events is aerosol transmission.” Jimenez said.Global Cases: 13,876,441 | Global Deaths: 593,087
July 19
With facing lawsuits demanding the release of detained people amid the novel coronavirus pandemic, the agency instead shuffled many to the private Immigration Centers of America (ICA) detention center in Farmville, Virginia. ICA Farmville is now in crisis. It has at least 268 out of around 360 detained people positive for the virus, making the jail by far the most stricken facility in ’s network of lockups.Global Cases: 14,043,176 | Global Deaths: 597,583
July 20
Video Clip: Florida Governor Ron DeSantis’ press briefing on his state’s response to the pandemic was met with loud protests, including shouts of “Shame on you Ron DeSantis!” President Trump goes one-on-one with Chris Wallace in a forty minute interview. President Trump interview with Chris Wallace: dismissed the country’s 75,000 daily cases, asserting “many of those cases heal automatically.” Trump said of the fact that the U.S. is seeing nearly 1,000 coronavirus deaths a day, “It is what it is. Take a look at Europe,” despite saying he takes the virus “very seriously.”President Trump Tweet: “We are United in our effort to defeat the Invisible China Virus, and many people say that it is Patriotic to wear a face mask when you can’t socially distance. There is nobody more Patriotic than me, your favorite President!”Florida’s largest teacher and education worker union, the Florida Education Association (FEA), is expected to announce legal action against the state of Florida over the education commissioner’s order to open school buildings five days a week in August.Arizona was one of the last states to close, and first to reopen, when the coronavirus started to sweep the nation this spring. Arizona now ranks as one of the country’s worst coronavirus hot spots, with more than 143,000 cases and more than 2,700 deaths as of this weekend. Hundreds of thousands of people are still out of a job, some for the second time this year. Restaurants, gyms and other companies are closing up shop once again — perhaps for good. Even government officials say they are bracing for a crippling blow, with the latest shutdown expected to cleave further into their still-souring finances.Kentucky Public Health Commissioner Steven Stack announces an “accelerating phase” of new cases. “If we don’t take some strong action, people will see just how bad it can get in Kentucky.” With 979 new cases of Covid-19 reported on Sunday, a day when many labs are closed, the statewide case total is 23,414 with 671 deaths. Gov. Andy Beshear (D) limits the size of social gatherings to 10 people and recommends a 14-day quarantine for people traveling to other states with substantial outbreaks.Global Cases: 14,348,858 | Global Deaths: 603,691
July 21
Video of President Trump first daily Coronavirus briefing after a several month gap. During this brief the President admits “It may get worse before it gets better.”The change in the way the government is collecting and reporting COVID-19 data has some experts worried that the involvement of private companies, like TeleTracking and Palantir, at different stages of the data collection and repository process could be a blow to transparency. Karen Hoffmann, former president of the Association for Professionals in Infection Control and Epidemiology, calls the new system a “black box.” “The data is now going to be going into a non-public-accessible data collection point,” Hoffman said. “So I think that can be useful for people that don’t want to have that data shared. The public can’t access it, whereas the CDC data is always very transparent.”A Kentucky circuit Judge has struck down all of Gov. Andy Beshear’s (D) emergency COVID-19 orders as unconstitutional. In a written order referencing philosophers, historians and statesmen going back more than two millennia, and soldiers perishing at Valley Forge, Boone Circuit Judge Richard Brueggemann argued that Beshear violated the constitutional rights of the plaintiffs through his executive orders to slow the spread of the pandemic. Stating that the questions at issue in the case are not about politics, Brueggemann wrote they are rather about “whether the constitution applies during a virus. […] Under our constitutions, government may not uproot liberty on a hope that it can hide society from pathogens, Individuals, not government, should decide if the risk of walking out their front door is worth the potential reward.”Global Cases: 14,562,550 | Global Deaths: 607,781
July 22
Video: President Trump coronavirus briefing.White House senior adviser Kellyanne Conway on Wednesday accuses the states plagued with skyrocketing COVID-19 cases of being too hasty with reopening their economies. “Some of these states blew through our criteria, blew through our phases and they opened up some of the industries a little too quickly, like bars,” Conway says. She ignores that in April Trump threatened to “take very strong action” against states that didn’t reopen quickly enough to his liking and falsely claimed that he had the “total” authority to do so. He openly supported “re-open” protesters in several Democratic-led states.The United States government has abruptly ordered China to “cease all operations and events” at its consulate in Houston, Texas, within 72 hours. US State Department spokeswoman Morgan Ortagus said the consulate was directed to close “in order to protect American intellectual property and Americans’ private information” but did not immediately provide additional details of what prompted the closure.Pfizer and BioNTech announce they will supply the federal government with 100 million doses of coronavirus vaccine under a $1.95 billion deal, the biotech companies. The agreement via the Trump administration’s Operation Warp Speed vaccination effort would allow the government to acquire an additional 500 million doses of the vaccine candidate, provided it has proved effective and secures regulatory approval.The Trump administration awarded Novavax a $1.6 billion vaccine contract earlier this month as part of its Operation Warp Speed initiative. The deal with the publicly traded Maryland company, which has never brought a vaccine to market in its 33-year history, will cover late-stage clinical trials and secure 100 million doses of vaccine for the government, if it passes trials. The top executives at Novavax stand to collect tens of millions of dollars in compensation even if their treatment never makes it to market.China is claiming the dubious honor of the first nation to roll out an experimental coronavirus vaccine for public use, beginning to inoculate high-risk groups. The vaccine has not passed standard clinical trials. Beijing health officials said they are beginning to dose some medical workers and state-owned enterprise employees with an experimental coronavirus vaccine under “urgent use” protocols.A Quick pivot to new COVID-19 reporting rules meant ‘chaos’ for hospitals. Many health systems had just two days to expand or overhaul their COVID-19 patient-data-reporting practices, according to leaders from more than 10 state hospital associations. Public health experts and industry groups have expressed concerns that the process, which gives the reins to the will lead to politicization of vital real-time information. and sent a new letter today to the head of TeleTracking Technologies, the company the Trump Administration recently awarded a six-month, $10.2 million contract that creates a system to replace the as the collector of Covid-19 data from hospitals, demanding answers to better understand the circumstances in which this contract was awarded. The Senators seek to understand why in the middle of a rapidly escalating global pandemic, the White House and the have curtailed use of a system that has collected public health data for over 15 years.The American Alliance of Museums, an organization that solely represents all museums across the country, issues a dire warning that one-third of museums risk permanently closing as funding sources dwindle as a result of the COVID-19 closures. Laura Lott, President & CEO of AAM, says “The distress museums are facing will not happen in isolation. The permanent closure of 12,000 museums will be devastating for communities, economies, education systems, and our cultural history.”Global Cases: 14,765,256 | Global Deaths: 612,054
July 23
Video of President Trump’s daily Coronavirus briefing. In the beginning of his daily Coronavirus briefing, President Trump announced he has canceled the Republican national convention scheduled for next month in Jacksonville, Fla., saying he wanted to keep his supporters safe from the coronavirus pandemic and protesters. The formal nominating process scheduled to take place in Charlotte will proceed, but the large convention with all its pomp and circumstance planned for Jacksonville is canceled.The releases new guidance to K-12 schools on COVID-19 symptom screening as part of a school reopening process. This guidance specifically does not recommend universal symptom screening of all grades K-12 students be conducted by schools. Investigative reporting released in September reveals the Trump administration overruled scientists in writing the final version of this guidance. As of mid-July, 55 percent of the 132,500 pandemic-era closures on Yelp are now permanent. Over the coming months, expiring leases will force many more businesses to make existential decisions. “Businesses are needing to decide, ‘Do I renew my lease on my space for another year?’ It is really hard to make a one-year commitment to paying rent when businesses are closing down for the second time and there’s no end in sight to this virus,” says Harvard University postdoctoral researcher Michael Stepner. “The longer these temporary closings go on, the more of them will turn permanent.”Rethinking higher education; As students prepare for their college classes, many are wondering if online courses are worth the tuition fees.Global Cases: 15,012,731 | Global Deaths: 619,150
July 24
White House Press Sec. Kayliegh McEnany holds a press briefing. Moments ago, the released new, updated guidelines that calls for schools to fully reopen amid the coronavirus pandemic. Video Clip: White House Press Secretary answers the question why schools should open but the Florida GOP convention was canceled.The release new guidelines with a heavy focus on reopening schools in the fall, saying children are less likely to experience severe symptoms or spread the virus in schools. These guidelines reflect the priorities of the Trump administration and come just two weeks after Pres. Trump called their initial guidelines too restrictive and ‘very tough.’The federal moratorium on evictions in properties with federally backed mortgages and for tenants who receive government-assisted housing expires. The Urban Institute estimated that the provision covered nearly 30% of the country’s rental units.The 10 largest retailers in the U.S. and most of the top 40, as ranked by the National Retail Federation (NRF) based on sales, have implemented, or are in the process of implementing, chainwide mandatory mask mandates.During this week of July 20, the number of positive tests in Marion County Jail, Florida, hit 209 inmates. Courts remained closed to jury trials, leaving fewer options to those awaiting judgment. The inmate population is 1,458, with 14% testing positive.Global Cases: 15,296,926 | Global Deaths: 628,903
July 25
US Dept of Labor Report: The total number of people claiming initial jobless benefits for the week ending July 11 was 1.434 million, an increase of 12 thousand from the previous week. This is the second week in a row first time claims have increased.Local television stations owned by the are set to air a conspiracy theory over the weekend that suggests , the nation’s top expert on infectious diseases, was responsible for the creation of the coronavirus. Tweet: “After further review, we have decided to delay this episode’s airing. We will spend the coming days bringing together other viewpoints and provide additional context. All stations have been notified not to air this and will instead be re-airing last week’s episode in its place.”Global Cases: 15,581,009 | Global Deaths: 635,173
July 26
During a televised interview kept up with his tradition of spewing happy talk on COVID-19 by baselessly touting that the economy would grow later this year despite coronavirus cases continuing to surge nationwide.He expressed optimism that jobless claims will fall, that most economists and Wall Street suggest that the country is in “a self-sustaining recovery,” and stated that growth is “very positive” because he still thinks “the V-shaped recovery is in place,” which will lead to a 20% growth rate in the third and fourth quarters. says that the next round of coronavirus relief will include $1,200 stimulus payments to Americans and the Trump administration will lengthen the federal eviction moratorium. The federal eviction moratorium has protected millions of renters in the last four months from getting evicted, but expired on July 24. Video clip of interview. Walmart won’t enforce its recently announced policy on customers wearing masks because it fears staff could be attacked by shoppers angry at being challenged.Global Cases: 15,785,641 | Global Deaths: 640,016
July 27
President Trump coronavirus briefing.In a televised event organized by the Tea Party and held on the steps of the US Supreme Court, a member of the group “America’s Frontline Doctors,” Dr. Stella Immanuel, a Houston-based primary care physician and minister, claims “This virus has a cure. It is called hydroxychloroquine, zinc, and Zithromax. I know you people want to talk about a mask. Hello? You don’t need (a) mask. There is a cure.” Dr. Stella Emmanuel has made previous claims as “sex dreams involving demons cause illnesses and that alien DNA is used in medication;” and ” the U.S. government is run in part not by humans but by “reptilians” and other aliens.” President Trump retweets the video with Dr. Stella Emmanuel’s covid-19 claims. It was later removed from Twitter, along with the original news video. The video was also removed from other social media on the basis of making unsubstantiated claims about a medication.Senate Republicans rolled out their major pieces of a $1-trillion economic relief plan, the HEALS Act, a planned fifth Coronavirus relief bill. Highlights include a second round of $1,200 coronavirus stimulus payments, and slash enhanced federal unemployment payments from $600 a week to $200. It includes $100 billion for schools to either reopen or adapt to online instruction; a sequel to the popular Paycheck Protection Program targeting more vulnerable small businesses; and new tax incentives to encourage employers to bring employees back to work. It would also provide liability-protections to businesses from coronavirus-related lawsuits, This bill was created without any input from Democrats, who released their on May 15. The Senate Republican’s proposal was an opening bid that would have to be reconciled with Democrats, who’s recovery package would spend three times as much and extend the $600 per week in extra unemployment aid through the end of the year.Global Cases: 16,114,449 | Global Deaths: 646,641
July 28
President Trump coronavirus briefing. When questioned about retweeting the previous day’s remarks by Dr. Stella Emmanuel, he states he thought they were very respectable and impressive doctors. When asked a follow-up question about his retweet, he walks off the podium and ends the press briefing.Major League Baseball’s 2020 season is not even a week old and the Miami Marlins are up to at least 17 reported positive cases of COVID-19 between players and coaches. The “vast majority” of Nationals players have voted against traveling to Miami for this weekend’s three-game series, but the final decision rests with MBL. A number of MLB games have been canceled or rescheduled.The American Federation of Teachers, which represents 1.7 million school employees, issues a resolution authorizing its members to strike if their schools plan to reopen without proper safety measures. The union’s president Randi Weingarten blasted President Donald Trump for ordering schools to reopen even as the virus continues to surge. He calls Trump’s response “chaotic and catastrophic,” saying it has left teachers afraid.Tweet by Dr. : “Today has seen a remarkable push of pro-hydroxychloroquine propaganda. The America’s Frontline Doctors video on Breitbart. Trump retweeting a claim that it works, now removed by Twitter. Massive social media action. Rudy (below). I don’t understand it, but it feels coordinated.”Study finds three-quarters of recovered Coronavirus patients have Heart damage months later.Global Cases: 16,341,920 | Global Deaths: 650,805
July 29
Investigative reporting has found serious irregularities in the process by which the Trump administration awarded a multi-million dollar contract to TeleTracking Technologies. The initially characterized the contract with TeleTracking as a no-bid contract. Investigations determined the had directly phoned the company about the contract, according to a company spokesperson. TeleTracking CEO Michael Zamagias had links to the New York real estate world — and in particular, a firm that financed billions of dollars in projects with the Trump Organization. The contract is at the center of a controversy over the Administration’s decision to move COVID-19 data reporting function from the to the .Commentary: President Donald Trump’s return as the face of the Covid-19 response has deteriorated into a misinformation masterclass that explains why America is in such a mess. […] He painted a misleading picture of a viral surge still raging across Southern and Western states that is showing new signs of spreading deeper into the heartland, saying large portions of the country were “corona-free.” […] And he launched a stunning new pitch for hydroxychloroquine, the anti-malaria drug beloved by conservative media but that has not been shown in rigorous clinical trials to be an effective treatment for Covid-19.Union leader Randi Weingarten warns that teachers in states like Florida, Arizona and Texas are the most likely to strike in protest of unsafe working conditions amid the pandemic.Global Cases: 16,558,289 | Global Deaths: 656,093
July 30
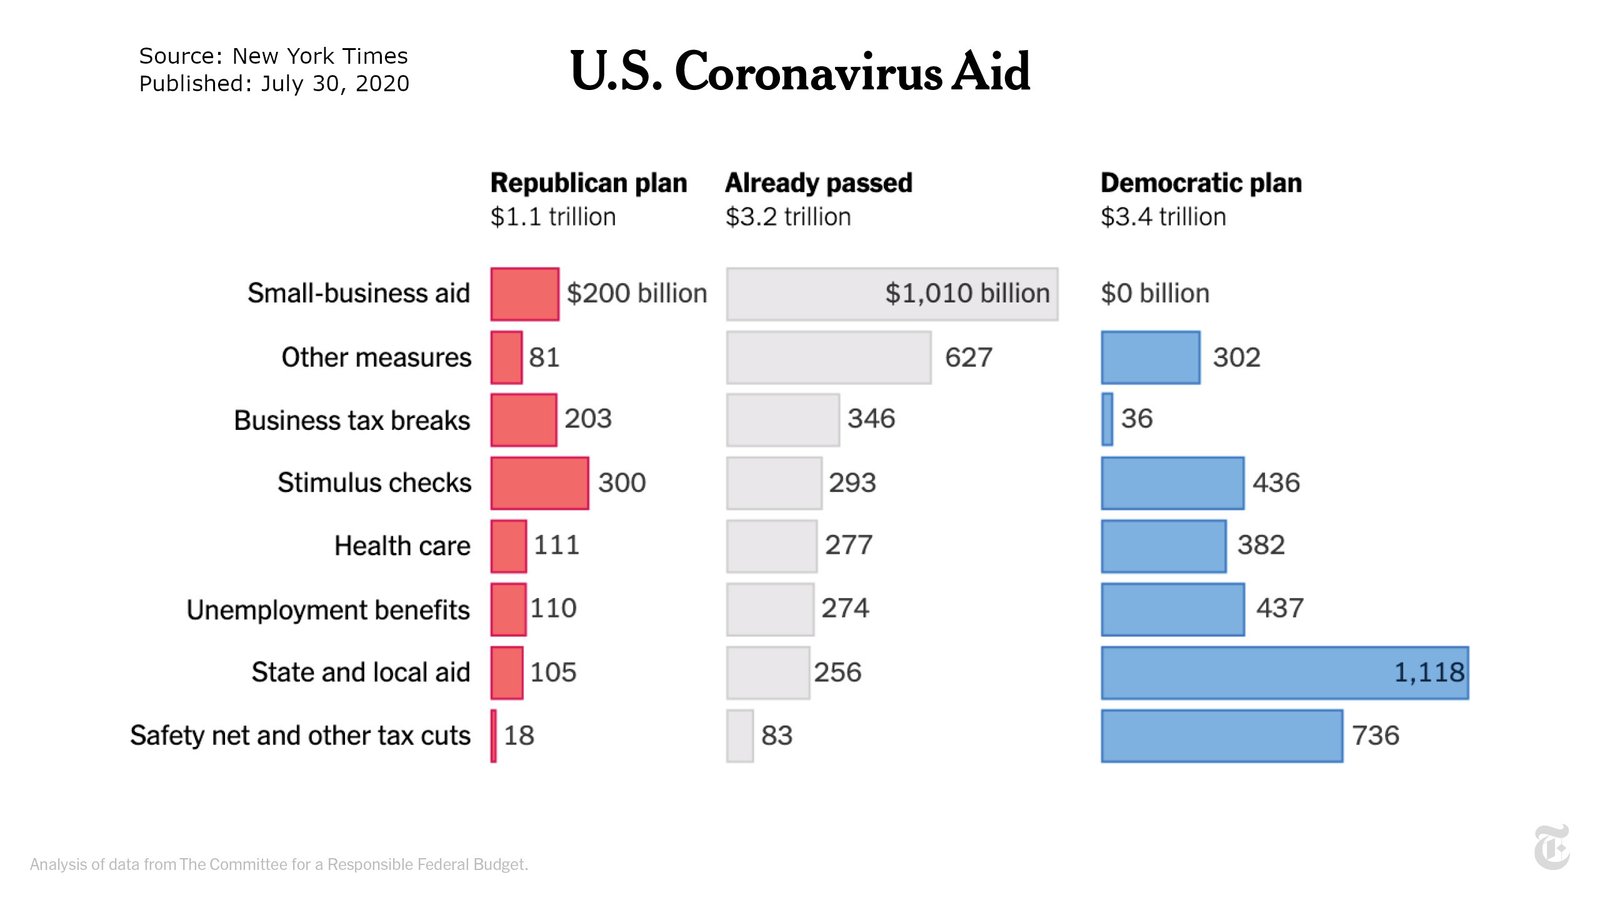
There is little overlap in the plans released by Democrats and Republicans for another round of federal aid to address the Covid-19 pandemic. The House Democrats’ opening offer, a $3.4 trillion package that passed the chamber May 15, would extend $600 weekly unemployment payments and provide $1 trillion more in state and local aid. The Senate Republican plan, a $1.1 trillion package announced July 27, includes scaled-back unemployment benefits and more funding for small-business loans.The Commerce Department reports the coronavirus pandemic triggered the sharpest economic contraction in modern American history. Gross domestic product — the broadest measure of economic activity — shrank at an annual rate of 32.9% in the second quarter. This economic shock was more than three times as sharp as the previous record — 10% in 1958 — and nearly four times the worst quarter during the Great Recession.President Trump Tweet: “With Universal Mail-In Voting (not Absentee Voting, which is good), 2020 will be the most INACCURATE & FRAUDULENT Election in history. It will be a great embarrassment to the USA. Delay the Election until people can properly, securely and safely vote???” Legal experts point out that the president has no power over when the United States holds federal elections. Only Congress can set the date for National elections. Congress chose a date, the first Tuesday following the first Monday in November, in 1845, and it has not been changed since.Changes in federal reporting methods have placed a significant strain on hospitals throughout the country and, at least temporarily, made the data hospitals report to states incomplete and unreliable. Hospitals—many in regions with major outbreaks—were given two days’ notice to complete these changes, and many have not yet been able to comply fully with the new directive. Many hospitals have struggled to report their data to anyone under the strain imposed by the changeover. As a result, some states have disclosed incomplete data reporting from hospitals—or taken their hospital data offline entirely—while many others posted declining numbers without explanation.More than 2,200 Pennsylvania immigrants who were part of a class-action lawsuit filed on June 11 have now taken their naturalization oaths through formal ceremonies, and will be able to vote in November. The class-action suit was dismissed. An estimated 125,000 immigrants around the country are still in limbo, awaiting the final step to becoming naturalized American citizens.Former Republican Presidental Candidate dies from coronavirus. Cain was hospitalized July 2, after attending President Trump’s Tulsa, Oklahoma, campaign rally. Cain was an outspoken opponent of wearing face masks and social distancing.Global Cases: 16,812,763 | Global Deaths: 662,095
July 31
The only found out after-the-fact about a sudden Trump administration decision to use a private contractor to collect COVID-19 data from hospitals. “We weren’t directly involved in the final decision” Director testified to the House Select Subcommittee on the Coronavirus Crisis. “Well I was told, actually, once the secretary’s office made the decision, that that was the decision,” Redfield said, referring to the Secretary .How Many People in the U.S. Are Hospitalized With COVID-19? Who Knows? The change in data reporting has created widespread confusion, leaving some states in the dark about their hospitals’ remaining bed and intensive care capacity and, at least temporarily, removing this information from public view. As a result, it has been unclear how many people are in hospitals being treated for COVID-19 at a time when the number of infected patients nationally has been soaring.Commentary on the government’s switch from the database to the TeleTracking database: The end result of this process is that, where the data was highly visible, more than 6,000 hospitals nationwide are now entering their data into a database that is controlled by a contractor and not directly by the government, using proprietary software that the government does not own. And the data that actually ends up being fed back to the public is only what TeleTracking provides.The Trump Administration is moving to give the Department of Defense control over logistics in distributing the COVID-19 vaccine, a move that infectious disease experts describe as “unprecedented.” “It’s totally unprecedented,” Dr. Susan Hassig, an epidemiologist at Tulane University School of Public Health and Tropical Medicine in charge of the epidemiology program, told TPM. The CDC is the only federal agency with connections to all local public health departments, “who are the on-the-ground coordinators for public health interventions.” Tweet: “Distributing a vaccine will be complex. During the H1N1 pandemic, an unheralded success was delivery of vaccines through the robust infrastructure of the Vaccines For Children program. DOD has zero experience sending vaccines to doctors in the US.”Two new studies from different parts of the world have arrived at the same conclusion: that young children not only transmit SARS-CoV-2 efficiently, but may be major drivers of the pandemic as well. The first reports findings from a pediatric hospital in Chicago, Illinois. The second was conducted in the mountainous province of Trento, Italy. Both studies spell serious implications for countries contemplating whether or not to reopen schools in the face of lingering and out-of-control outbreaks, the United States included.Global Cases: 17,106,007 | Global Deaths: 668,910
Contact Us


Meaning Of Icons
Meaning of icons used in the main timeline narrative. All icons are linked to their source reference: General Information Continuation of previous information, with a different reference State-of-Emergency or Stay-At-Home Declared or Rescinded Provides a video clip Provides an audio clip Provides a pop-up information window
– Move your mouse over a boldened acronym, name, or term, used in this timeline for an  Link for a Download File
Trump Twitter Tweets Defunct
This timeline cites a number of Twitter Tweets including those of then-President Trump. On January 8, 2021, Twitter deactivated President Trump’s Twitter account. This caused the citation links to become inactive.
Format for Daily Cases Counts
Starting with June 30 I’ve added a new field “Number New Cases” to daily cases counts for the United States. I wanted to better illustrate just how quickly new cases are increasing on a daily basis.
I’ve also added a chart at top of this page showing daily new cases in the US compared to the European Union.
Timeline Source Data File
I built this timeline from a set of working notes in spreadsheet format. At present, my working notes have 1247 news entries, in addition to other references that form my “Additional Reading” sidebar entries, and other source references. Not all these news items are published in this timeline, for various reasons. My notes are freely available under a Creative Commons license (BY SA) to any writer or researcher who finds this work useful.
Download File
The Story So Far…

Story Threads Weaving Through This Timeline
Letter To Health and Human Services Director Alex Azar
Letter from nearly 350 Health Organizations requesting shield the from overt political interference in managing the COVID-19 Pandemic.
U.S. Bureau of Labor Statistics Report
The Impact of the Coronavirus (COVID-19) Pandemic on
The Employment Situation for June 2020. Source data for the chart displayed on the July 2 timeline block.
CDC Public Schools Reopening Guidelines
-Published Decision Tree for use in making (re)opening decisions regarding K-12 schools during the COVID-19 pandemic. Available as of July 8, 2020
K-12 Schools and Childcare Programs
FAQs for Administrators, Teachers, and Parents during the COVID-19 pandemic. Available as of July 8, 2020
Community Interventions and Critical Populations Task Force
CDC COVID-19 Emergency Response COVID-19 Emergency Response
This briefing document was obtained and published by The New York Times marked “For Internal Use Only.” It was apparently intended for federal public health response teams to have as they are deployed to hot spots around the country. This document appears to have circulated the same week that Vice President Mike Pence announced that the would release new guidelines, saying that the administration did not want them to be “too tough.” It appears to be mostly a compilation of documents already posted online, along reopening plans drafted by states, districts and individual schools and universities. The recommendations in this document, praised by education leaders as “thoughtful and complete,” but never released and at odds with President Trump and his administration on their demands for “re-opening schools.”
Note the date on this document “July 8, 2019” appears to be a typo.
American Academy of Pediatrics Return to School Guidance
Official guidance from the American Academy of Pediatrics, in a joint statement with the American Federation of Teachers (AFT), National Education Association (NEA) and AASA, The School Superintendents Association, on reopening K-12 schools. Released July 10
Download File
JAMA Research Letter on Lingering Effects of COVID-19
In a study from Italy, released July 9, researchers identify the aftereffects of patients who nominally recover from COVID-19. According to this study, only 12.6% reported being symptom free. A worsened quality of life was observed among 44.1% of the group with the most common symptoms being fatigue and labored breathing. Other issues include permanent organ damage or persistent neurological or psychiatric impacts.
Study available at JAMA Network or download here.
Report by the White House Coronavirus Task Force to Governors
This report, circulated among White House staff but never officially released, provides a state-by-state analysis of the coronavirus status in each state. The report includes a recommendation for 18 states to enact tougher control measures. Dated July 14.
Download This Document
Executive Orders From Georgia Governor Brian Kemp
Update to existing executive orders issued July 16, on state actions for preventing the spread of COVID-19. Includes prohibition on any states or counties from explicitly requiring residents to wear face masks or other face coverings.
Letter from Sen Schumer and Sen Murray to TeleTracking CEO Michael Zamagais
Senator Schumer and Senator Murray write a letter to TeleTracking Technologies CEO Michale Zamagias requesting details on how his company was awarded a sole-source contract for collecting and reporting Coronavirus public health information, formerly managed by the CDC. July 22
Download File
Revised CDC Guidelines for Re-Opening Public Schools
Revised guidelines issued July 23 on re-opening public K-12 schools. These guidelines reflect Trump administration priorities. A New York Times report reveals the Trump administration overruled scientists in the final released version.
Additional Reading
Laborers in poultry-processing and meatpacking plants have been hit extraordinarily hard by the coronavirus. This investigative report details how a secretive titan behind one of America’s largest poultry companies, who is also one of President Trump’s top donors, is ruthlessly leveraging the coronavirus crisis—and his vast fortune—to strip workers of protections. Published July 13, 2020
How Trump Is Helping Tycoons Exploit the Pandemic
‘Superspreading’ events, triggered by people who may not even know they are infected, propel the coronavirus pandemic.Jose-Luis Jimenez, a researcher at the University of Colorado Boulder, was one of 239 scientists who penned an open letter to the WHO, calling for greater recognition of the role that clouds of fine aerosols containing the virus may play in its spread. “It is becoming clear that the pandemic is driven by superspreading events, and that the best explanation for many of those events is aerosol transmission.”
‘Superspreading’ events, triggered by people who may not even know they are infected, propel coronavirus pandemic
Prelude <> Nov/Dec 2019 <> January 2020 <> February <> March <> April <> May <> June<>July <> August <> September <> Source Data